neuroimjs
npmVolumetric neuroimaging data, NIfTI I/O, spatial transforms and WebGL orthogonal slice viewers in JavaScript
npm install neuroimjs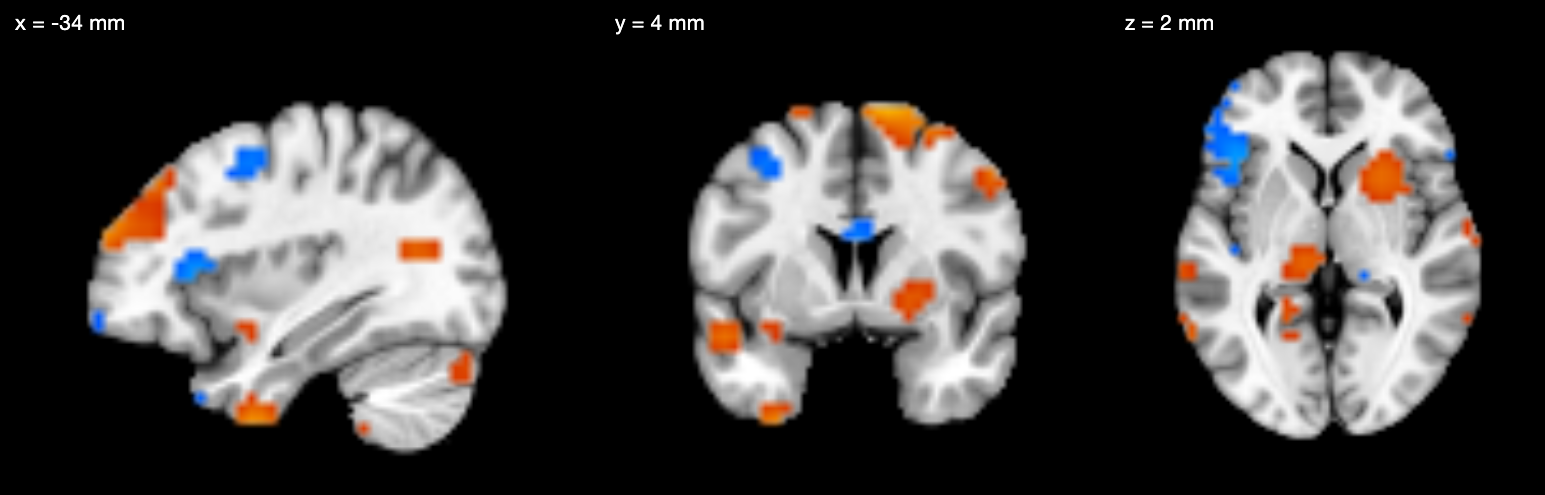
A simulated statistic map on the MNI152 template, drawn by neuroimjs 0.6.0 as three SingleSliceViewer views linked by ViewSynchronizer (demo/hero.js in the showcase source).
Classes NeuroSpace · NeuroVol · NeuroVec · ROIVol
Input / output NIfTI-1/2 read in the browser and Node (qform-only NIfTI-2 not yet); NIfTI-1 write in Node
Viewers Orthogonal and single-slice views, drawn with WebGL through PIXI.js
Analysis building blocks Group statistics, searchlights, ROIs, filtering
What it does
01
NIfTI files are read in the page, with their geometry
readNiftiArrayBuffer() decodes a .nii or .nii.gz file from an ArrayBuffer, applying intensity scaling and swapping big-endian bytes, and returns a NeuroVol whose NeuroSpace holds the grid dimensions, voxel spacing and affine. gridToCoord() and coordToGrid() convert between voxel indices and millimetres. In a VolStack, layer 0 sets the slicing grid, and a layer on another axis-aligned grid is drawn at its own world position, so the 4 mm map lies correctly over the 2 mm template.
The template decodes to a 97 × 115 × 97 grid of 2 mm voxels (441 KB gzipped) and the statistic map to 48 × 57 × 48 at 4 mm (94 KB). For the 4 voxels checked (the map’s maximum and minimum and two opposite corners), gridToCoord() returns the same millimetre coordinates that neuroim2 0.19.1 reports for the same file.
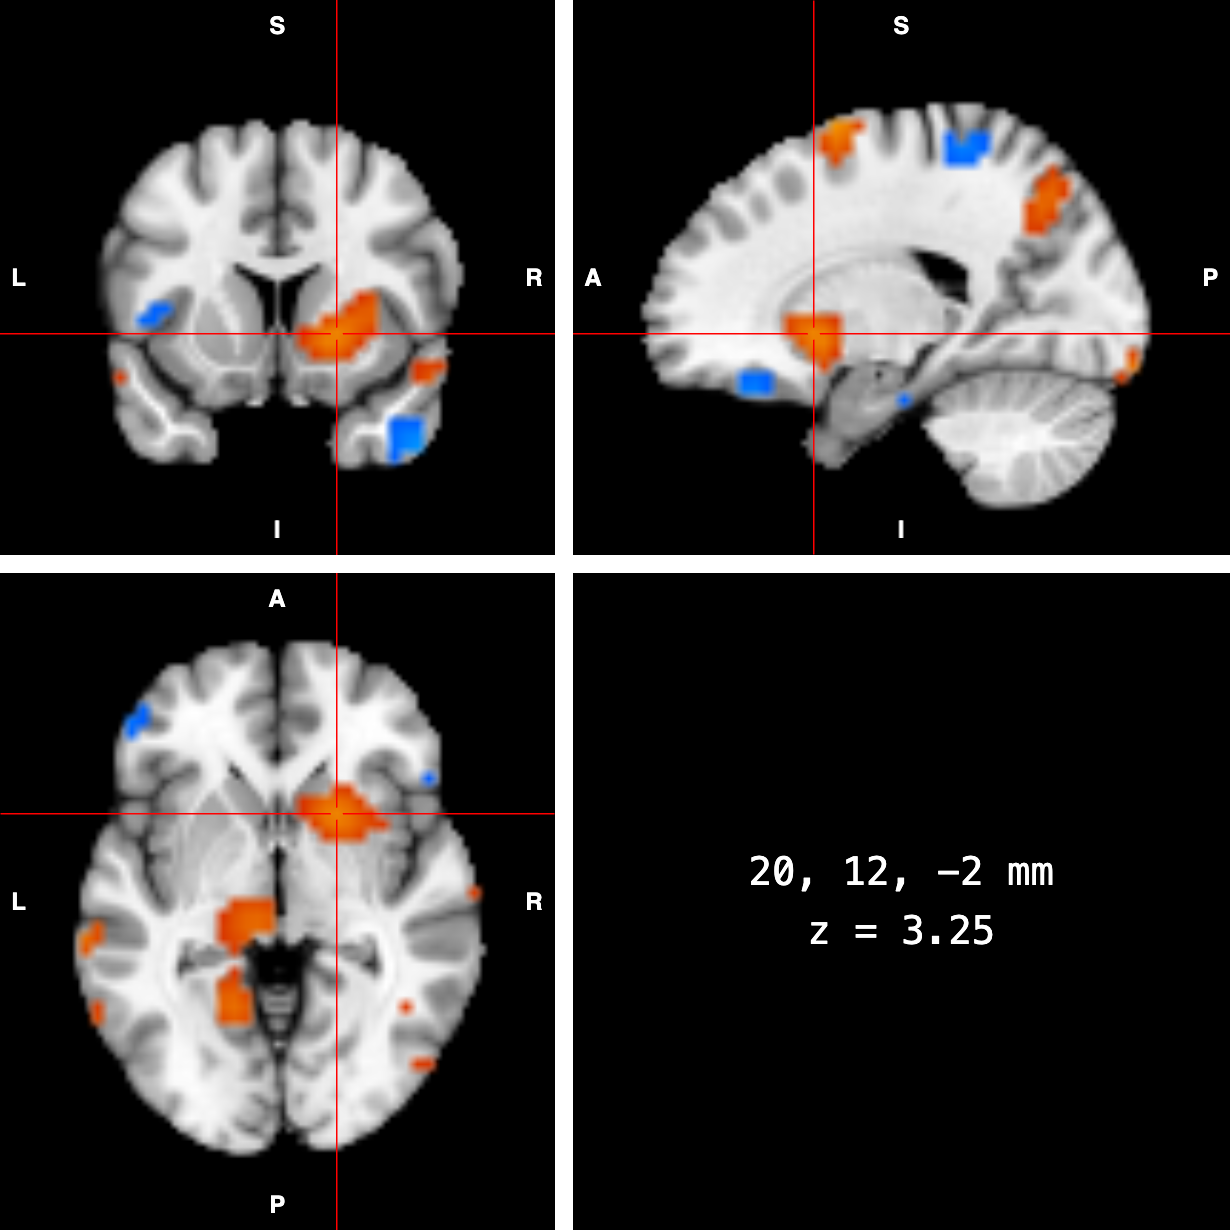
SimpleOrthogonalViewer with layout: 'ortho'; the fourth cell shows the crosshair position and the value from getValue(). Template: MNI152NLin2009cAsym, 2 mm (TemplateFlow). The statistic map is simulated.
import {
  readNiftiArrayBuffer, VolLayer, VolStack,
  ColorMapFactory, SimpleOrthogonalViewer,
} from 'neuroimjs/browser';

// Fetch and decode two NIfTI files in the page: the MNI152
// template (2 mm) and a statistic map that neuroim2 wrote
// on a 4 mm grid. Each volume carries its NeuroSpace.
const read = async (url) =>
  readNiftiArrayBuffer(await (await fetch(url)).arrayBuffer());
const t1 = await read('mni152-2mm.nii.gz');
const z = await read('zstat-4mm.nii.gz');

console.log(z.space.dim, z.space.spacing);
console.log(z.space.gridToCoord([0, 0, 0]));  // mm

// Layer 0 sets the slicing grid; the 4 mm map is drawn at
// its own world position over the 2 mm template.
const posneg = ColorMapFactory.createMultiStop(
  ['#40d0ff', '#1040ff', '#d01000', '#ffe040'], 256);
const stack = new VolStack(
  new VolLayer('t1', t1, ColorMapFactory.createGrayscale(),
               [3000, 9300]),
  new VolLayer('z', z, posneg, [-5, 5], [-2, 2]),
);

const viewer = await SimpleOrthogonalViewer.create(
  document.getElementById('viewer'), stack,
  { layout: 'ortho', showOrientationLabels: true });

// The fourth cell of the 'ortho' layout is free: use it
// for a readout of the crosshair position and z value.
const legend = viewer.getLegendElement();
viewer.onCoordChange((mm) => {
  const v = viewer.getValue('z', mm);
  legend.textContent = `${mm.map(Math.round).join(', ')} mm\n` +
    `z = ${v === null ? '–' : v.toFixed(2)}`;
});
viewer.setWorldCoord([20, 12, -2]);
02
A threshold hides a band of values
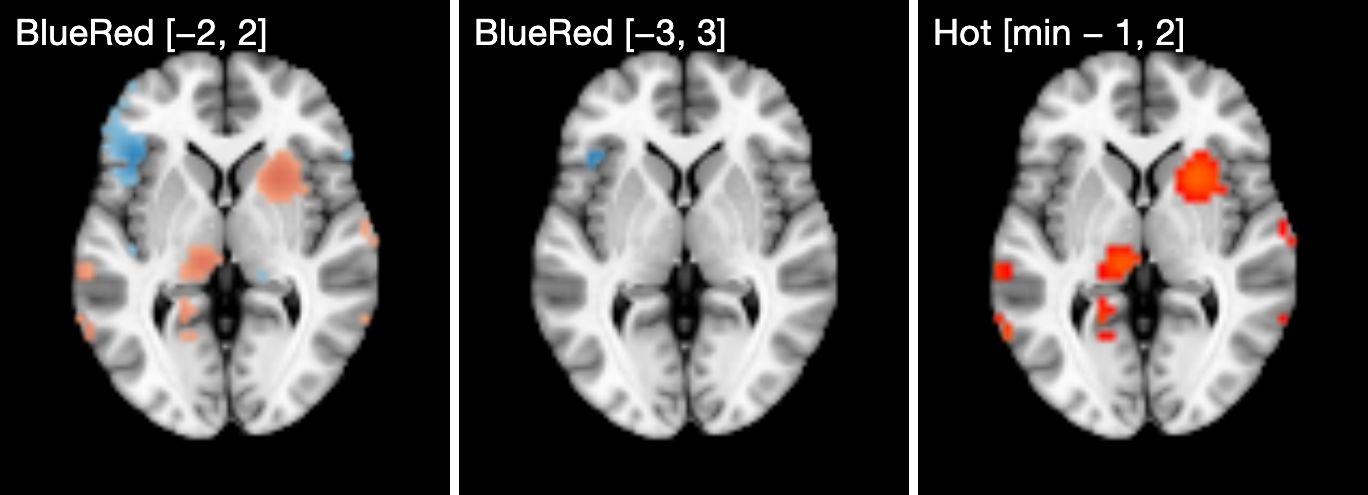
VolLayer(id, volume, colormap, range, threshold, opacity) binds a volume to a ColorMap, a display range and a threshold. The threshold [lo, hi] hides values strictly between lo and hi: [-2, 2] shows |z| ≥ 2, and [zMin - 1, 2] shows only z ≥ 2. ColorMapFactory.fromPreset() takes the ColorBrewer scales, Viridis, Inferno and BlueRed by name; createGrayscale(), createHot() and createMultiStop() build the others used on this page.
import {
  VolLayer, VolStack, ColorMapFactory, SingleSliceViewer,
} from 'neuroimjs/browser';

// One axial slice, three display settings. A threshold
// [lo, hi] hides values strictly between lo and hi, so a
// one-sided threshold puts lo below the data minimum.
const [zMin] = z.getRange();
const settings = [
  { cmap: 'BlueRed', range: [-5, 5], threshold: [-2, 2] },
  { cmap: 'BlueRed', range: [-5, 5], threshold: [-3, 3] },
  { cmap: 'Hot', range: [0, 6], threshold: [zMin - 1, 2] },
];

const panels = document.querySelectorAll('.panel');
for (const [i, s] of settings.entries()) {
  const cmap = s.cmap === 'Hot'
    ? ColorMapFactory.createHot()
    : ColorMapFactory.fromPreset(s.cmap);
  const layers = new VolStack(
    new VolLayer('t1', t1, ColorMapFactory.createGrayscale(),
                 [3000, 9300]),
    new VolLayer('z', z, cmap, s.range, s.threshold),
  );
  await SingleSliceViewer.createAxial(panels[i], layers,
    { initialCoord: [-34, 4, 2] });
}
03
Single views for custom layouts
SingleSliceViewer.createAxial(), createSagittal() and createCoronal() each put one view in a container, so the page arranges views with its own CSS; ViewSynchronizer links views that should share a crosshair, as in the image at the top. setMarkers() draws points given in world millimetres on any slice within half of slabMm of the point. Here the points are local maxima of |z| found with getAt() and converted with gridToCoord().
The scan finds 12 peaks (4 positive, 8 negative).
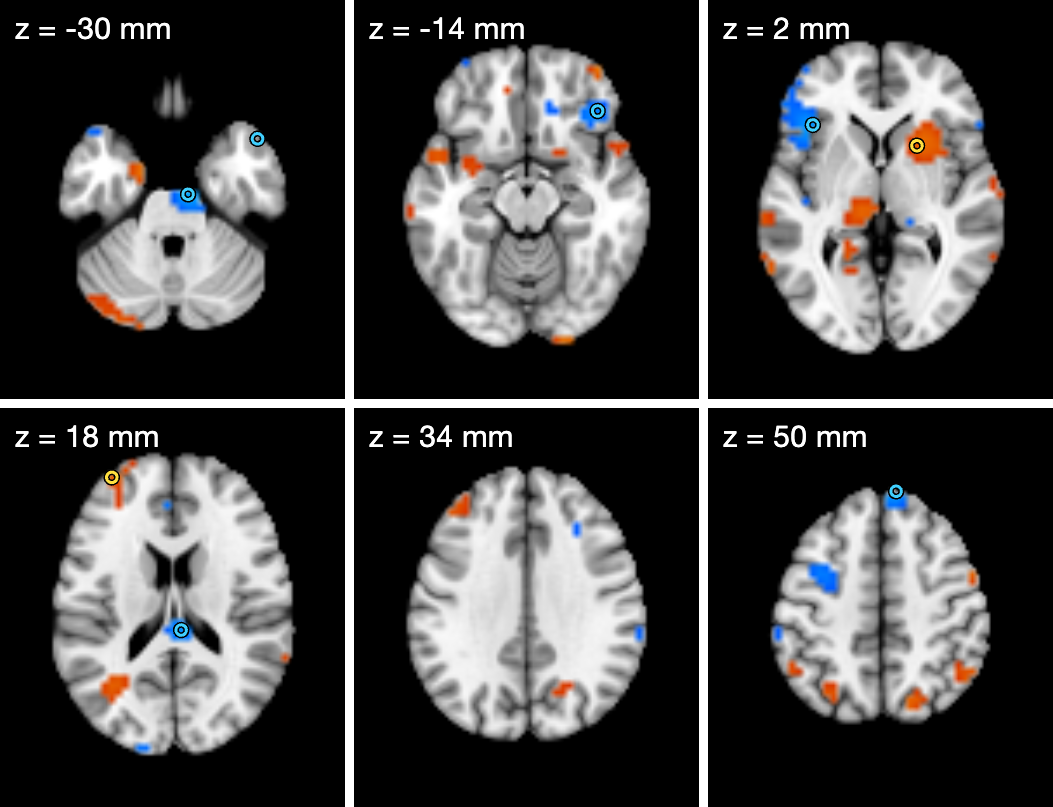
Yellow rings mark positive peaks and cyan rings negative peaks, with |z| > 3.
import { SingleSliceViewer } from 'neuroimjs/browser';

// Peaks: voxels with |z| > 3 that exceed all 26 neighbours,
// converted from grid indices to world millimetres.
const [nx, ny, nz] = z.space.dim;
const peaks = [];
for (let k = 1; k < nz - 1; k++)
  for (let j = 1; j < ny - 1; j++)
    for (let i = 1; i < nx - 1; i++) {
      const v = Math.abs(z.getAt(i, j, k));
      if (v <= 3) continue;
      let top = true;
      for (const [a, b, c] of offsets26()) {
        const w = Math.abs(z.getAt(i + a, j + b, k + c));
        if (w > v) top = false;
      }
      if (top) peaks.push({
        id: `peak-${peaks.length + 1}`,
        xyz: z.space.gridToCoord([i, j, k]),
        color: z.getAt(i, j, k) > 0
          ? '#ffe040' : '#40d0ff',
      });
    }

function* offsets26() {
  for (const a of [-1, 0, 1]) for (const b of [-1, 0, 1])
    for (const c of [-1, 0, 1])
      if (a || b || c) yield [a, b, c];
}

// Six independent axial views, 16 mm apart, in a CSS grid.
// Each draws the peaks within 8 mm of its plane.
const cells = document.querySelectorAll('.cell');
for (const [n, cell] of [...cells].entries()) {
  const view = await SingleSliceViewer.createAxial(cell, stack,
    { initialCoord: [0, 0, -30 + 16 * n] });
  view.setMarkers(peaks,
    { slabMm: 16, shape: 'ring', sizePx: 7 });
}
04
Group statistics computed in the browser
createReviewVecFromVolumes() stacks per-subject maps into a 4D volume after checking that they share dimensions, axes and affine. computeSufficientStats() stores each voxel’s count, mean and sum of squared deviations, which oneSampleTVolume(), meanVolume(), effectVolume() (mean/SD) and welchTVolume() take as input; the paired-difference functions take the two 4D volumes directly. Non-finite values are skipped voxel by voxel. Outside the simulation mask every subject is 0, so the variance is zero and t is NaN, which the viewer leaves transparent.
oneSampleTVolume() returns a Float64NeuroVol on the subjects’ 4 mm grid; across the 12 simulated subjects, t ranges from -15.6 to 12.9.
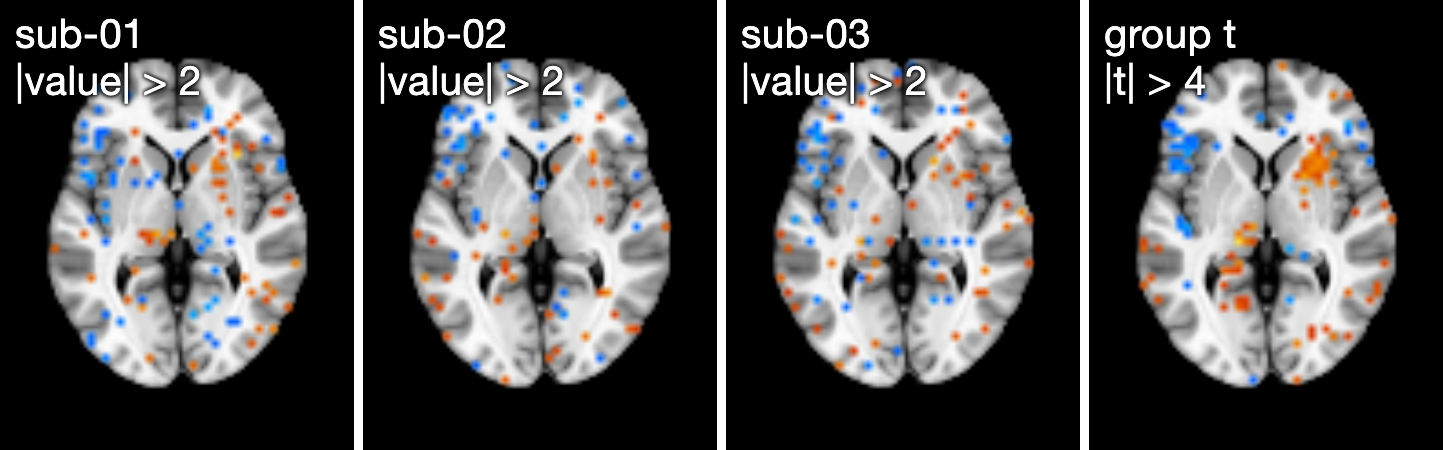
Simulated subjects: each is 0.5 times the map in figure 01 plus independent unit Gaussian noise. Subjects are shown at |value| > 2, the group map at |t| > 4.
import {
  FloatNeuroVol, createRng, createReviewVecFromVolumes,
  computeSufficientStats, oneSampleTVolume,
  VolLayer, VolStack, ColorMapFactory, SingleSliceViewer,
} from 'neuroimjs/browser';

// Twelve simulated subject maps on the 4 mm grid: half the
// group map plus independent unit Gaussian noise (seeded).
const rng = createRng(7);
const gauss = () => Math.sqrt(-2 * Math.log(1 - rng())) *
  Math.cos(2 * Math.PI * rng());
const zData = z.getData();
const subjects = Array.from({ length: 12 }, () => {
  const d = new Float32Array(zData.length);
  for (let v = 0; v < d.length; v++)
    d[v] = zData[v] === 0 ? 0 : 0.5 * zData[v] + gauss();
  return new FloatNeuroVol(z.space, d);
});

// Voxelwise one-sample t across subjects, in the page.
const vec = createReviewVecFromVolumes(subjects);
const tmap = oneSampleTVolume(computeSufficientStats(vec));

// Three subjects and the group map on the same slice.
const shown = [subjects[0], subjects[1], subjects[2], tmap];
const cols = document.querySelectorAll('.panel');
for (const [i, vol] of shown.entries()) {
  const lim = i < 3 ? 2 : 4;   // display threshold |value|
  const group = new VolStack(
    new VolLayer('t1', t1, ColorMapFactory.createGrayscale(),
                 [3000, 9300]),
    new VolLayer('map', vol, ColorMapFactory.createMultiStop(
      ['#40d0ff', '#1040ff', '#d01000', '#ffe040'], 256),
      [-2.5 * lim, 2.5 * lim], [-lim, lim]),
  );
  await SingleSliceViewer.createAxial(cols[i], group,
    { initialCoord: [-34, 4, 2] });
}
Try it

The same template and statistic map, in a SimpleOrthogonalViewer. Click a view to move the crosshair in all three; the line below the viewer reports its position in millimetres and the z value there. The mouse wheel steps through slices and is captured while the pointer is over a view, so the page does not scroll there; Ctrl/⌘ + wheel zooms, double-click resets the zoom, and ← / → step slices in the view the pointer last entered. On a phone, tap a view to move the crosshair; the viewer is best on a wider screen.
Loading it downloads 1.5 MB: 0.9 MB of JavaScript (the neuroimjs 0.6.0 browser bundle, which includes PIXI.js, MobX and Lit, and the 2 KB loader) and 0.5 MB of NIfTI data.
Works with
NeuroSpace, NeuroVol, NeuroVec, ROIVol and the searchlight iterators play the same roles in both libraries, and neuroimjs’s design notes treat neuroim2 as its R counterpart. Functions are renamed to camel case: read_vol → readVol, read_vec → readVec, grid_to_coord → gridToCoord; class names are unchanged. The statistic map on this page was written by neuroim2 and read by neuroimjs. Differences that matter when moving between them:
- Grid indices are 0-based.
gridToCoord([0, 0, 0])is neuroim2’sgrid_to_coord(sp, c(1, 1, 1)); add 1 to a neuroimjs index to get the R index. readVec()is time-first. It returns[T, X, Y, Z]data, and its 3D geometry is onvec.volumeSpace; neuroim2 usesc(x, y, z, t).- Transform choice. When a file’s qform code exceeds its sform code, neuroimjs uses the qform where neuroim2 uses the sform; when a file has neither transform, neuroimjs uses
diag(pixdim)where neuroim2 uses a centred, x-flipped affine.
Using it
Browser applications import everything from the self-contained neuroimjs/browser entry: viewers, layers, colormaps and readNiftiArrayBuffer(). Node code imports from neuroimjs, which adds readVol(), readVec(), writeVol() and the processing classes. The library is pre-1.0; the stability matrix lists the status of each module.
import { readNiftiArrayBuffer, SimpleOrthogonalViewer }
  from 'neuroimjs/browser';
Every figure on this page is rendered by neuroimjs 0.6.0 in headless Chromium by software/showcase/neuroimjs/make-figures.mjs in the site’s source, and the code shown with each figure is the code that drew it. make-data.R in the same folder writes the two NIfTI files with neuroim2. Template: MNI152NLin2009cAsym (Fonov et al., 2009, 2011; © 1993–2009 Louis Collins, McConnell Brain Imaging Centre, Montreal Neurological Institute, McGill University), via TemplateFlow; licence.